Datadog is a fantastic monitoring as a service company. Install their agent on your host and within seconds metrics are uploaded to their service to begin graphing. Their service can integrate with many popular products, but I have yet to find a plugin to integrate Datadog with one of the most talked about pieces of software today: OpenStack.
Luckily, Datadog is a very extensible product. They provide documentation on how to create your own plugins to upload metrics to their service.
This documentation, combined with the OpenStack APIs, has allowed me to create what I think is the first Datadog OpenStack plugin. Let me know if you have come across other Datadog OpenStack plugins.
What Does It Do?
OpenStack’s Horizon Dashboard is the graphical web front end to the OpenStack services.
Administrative users logged into the Horizon Dashboard can get an overview of how resources are allocated in their OpenStack environment as seen in the following screenshot:
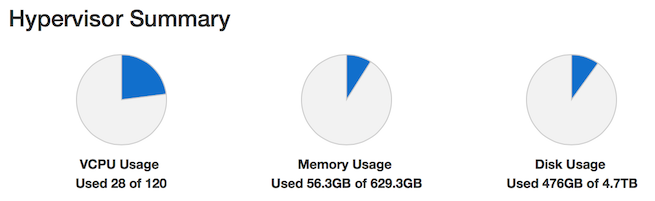
Those three simple pie charts represent the core resources an OpenStack environment provides: vCPU, Memory, and Disk. On their own, they give a cloud administrator a very quick glance into how much of those core resources are allocated - but, that’s about it.
A cloud administrator will always need an up-to-the-minute view of what core resources are allocated, but what is even more useful is a historical view. With this capability, a cloud administrator can quickly figure out when they need to add more resources to their OpenStack environment.
This is what the first iteration of this plugin does.
Every 20 seconds, the Datadog Agent will run the openstack-capacity-reporting plugin and upload the following metrics to Datadog:
- Number of running virtual machines
- Total vCPUs
- Allocated vCPUs
- Total Memory
- Allocated Memory
- Total Disk
- Allocated Disk
Those metrics are uploaded on a per compute node basis.
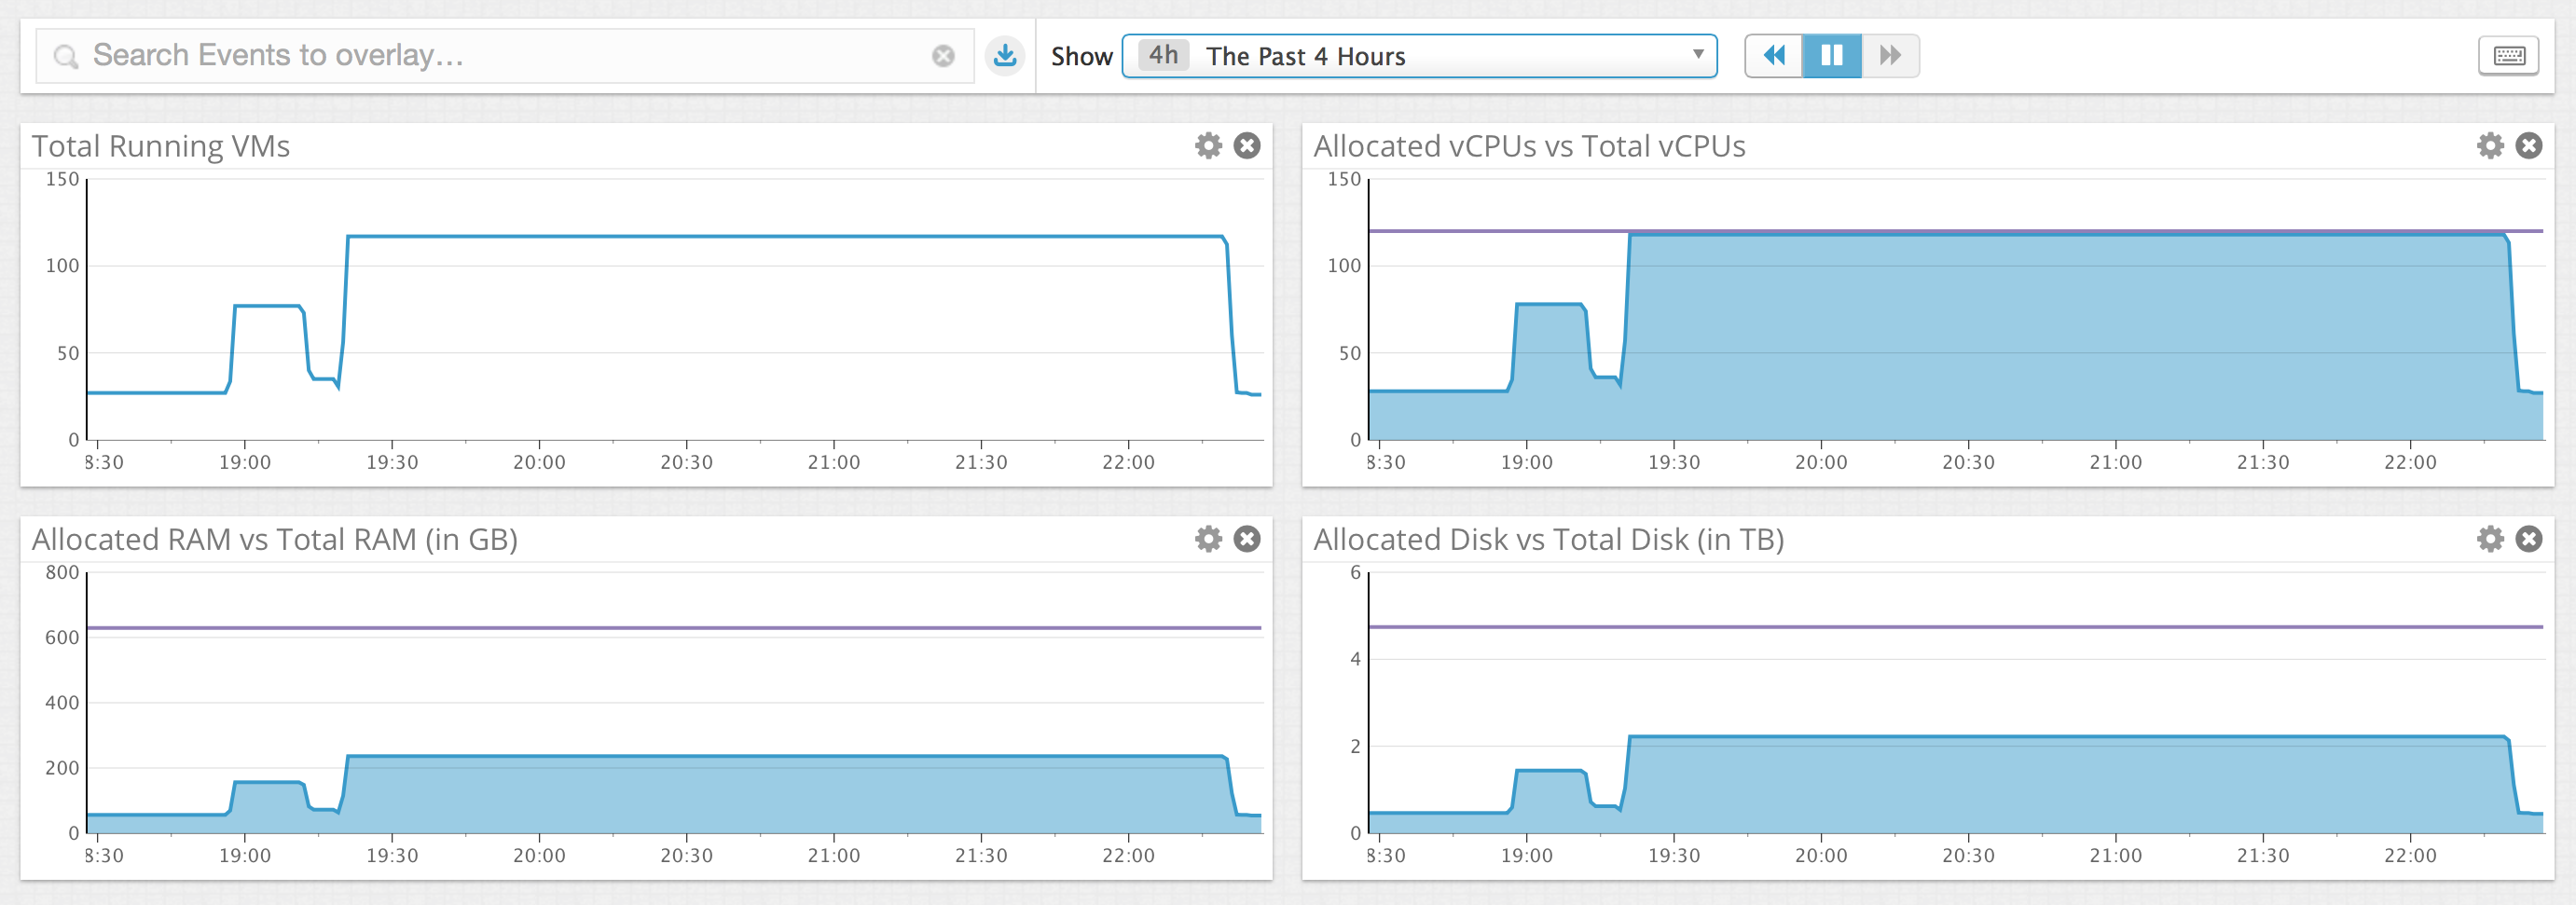
With those metrics available, you can get historical and current time series data of how your core resources are allocated as seen in the following screenshot:
Download
You can obtain my Datadog OpenStack Capacity Reporting plugin on GitHub.
As mentioned, this is the first iteration of this plugin. There are many other OpenStack metrics, such as allocated and total Cinder Volume storage, that can be queried.
I encourage you to submit Pull Requests or Fork my plugin to make it that much better.